%load_ext sql
%sql duckdb://
Loading configurations from C:\Users\NKeleher\code\ipa-data-tech-handbook\pyproject.toml.
Settings changed:
| Config | value |
|---|---|
| feedback | 0 |
| autopandas | False |
| autopolars | False |
| autolimit | 0 |
| displaylimit | 10 |
%load_ext sql
%sql duckdb://| Config | value |
|---|---|
| feedback | 0 |
| autopandas | False |
| autopolars | False |
| autolimit | 0 |
| displaylimit | 10 |
Create a table from a CSV file.
%%sql
CREATE TABLE penguins AS SELECT * FROM '../assets/data/penguins.csv'| Count |
|---|
Inspect the columns of the table.
%sqlcmd columns -t penguins| name | type | nullable | default | autoincrement | comment |
|---|---|---|---|---|---|
| species | VARCHAR | True | None | False | None |
| island | VARCHAR | True | None | False | None |
| bill_length_mm | FLOAT | True | None | False | None |
| bill_depth_mm | FLOAT | True | None | False | None |
| flipper_length_mm | BIGINT | True | None | False | None |
| body_mass_g | BIGINT | True | None | False | None |
| sex | VARCHAR | True | None | False | None |
Query the table using a SELECT statement.
%%sql
SELECT *
FROM '../assets/data/penguins.csv'
LIMIT 3| species | island | bill_length_mm | bill_depth_mm | flipper_length_mm | body_mass_g | sex |
|---|---|---|---|---|---|---|
| Adelie | Torgersen | 39.1 | 18.7 | 181 | 3750 | MALE |
| Adelie | Torgersen | 39.5 | 17.4 | 186 | 3800 | FEMALE |
| Adelie | Torgersen | 40.3 | 18.0 | 195 | 3250 | FEMALE |
Run analytical operations on the data.
%%sql
SELECT species, COUNT(*) AS count
FROM '../assets/data/penguins.csv'
GROUP BY species
ORDER BY count DESC| species | count |
|---|---|
| Adelie | 152 |
| Gentoo | 124 |
| Chinstrap | 68 |
Using jupysql store SQL query results as an object in a Jupyter notebook.
%%sql species_count <<
SELECT species, COUNT(*) AS count
FROM '../assets/data/penguins.csv'
GROUP BY species
ORDER BY count DESC
Plot the results of the query.
ax = %sqlplot bar --table '../assets/data/penguins.csv' --column species

# customize plot (this is a matplotlib Axes object)
_ = ax.set_title("Count of penguins by species")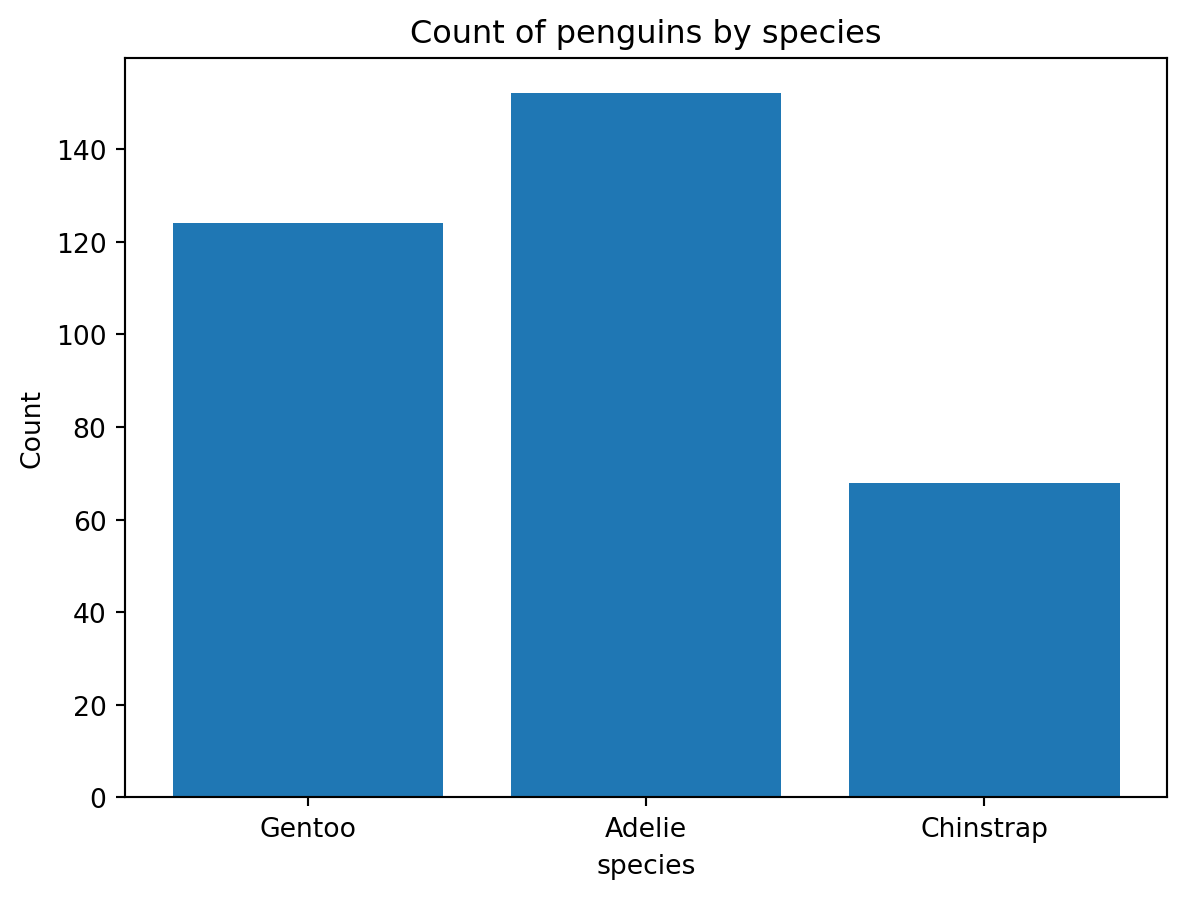
Use SQLFluff to lint SQL code.
Add SQLFluff to your virtual environment using pixi:
pixi add sqlfluff --pypiAssuming SQLFluff is installed in your virtual environment using pixi, you can run the following command to lint SQL code:
pixi run sqlfluff fix --dialect duckdb